
What is QuantStats and Why It Matters
QuantStats is a powerful Python library designed for analyzing the performance of algorithmic trading strategies. It provides comprehensive visualization and statistical tools, helping investors gain deeper insight into how strategies behave in real-world conditions. Whether you’re trading on Binance or Bybit, knowing how to interpret QuantStats reports is essential for making informed investment decisions.
Why Strategy Analysis Is Crucial for Investors
In today’s volatile economic climate, compounded by regulatory restrictions and market uncertainty, analyzing algorithmic strategies isn’t just helpful — it’s critical. Understanding performance metrics like PnL, drawdowns, and ratios helps investors manage risk and optimize returns. For investors seeking autonomy and control, especially in sanctioned markets, this knowledge is a strategic advantage.
Key Components of QuantStats Reports
PnL (Profit and Loss)
Definition and Significance
PnL represents your net trading performance over a selected time frame. It’s the most direct indicator of a strategy’s profitability.
How to Interpret PnL
When reviewing PnL data in QuantStats, don’t focus solely on total returns. Look at performance across market phases. Large spikes — even if positive — could signal high-risk behavior. Analyze PnL alongside market events to understand context and stability.
Drawdowns
What Are Drawdowns and Why They Matter
Drawdowns measure the decline from a portfolio’s peak to its lowest point. They are critical for assessing risk exposure. The deeper or more frequent the drawdowns, the more stress a strategy could face under adverse conditions.
Using Drawdowns to Guide Risk Management
QuantStats enables precise tracking of drawdown depth and duration. If your strategy suffers frequent or severe drawdowns, it may be worth reducing position sizes or implementing safeguards during volatile market conditions.
Ratios
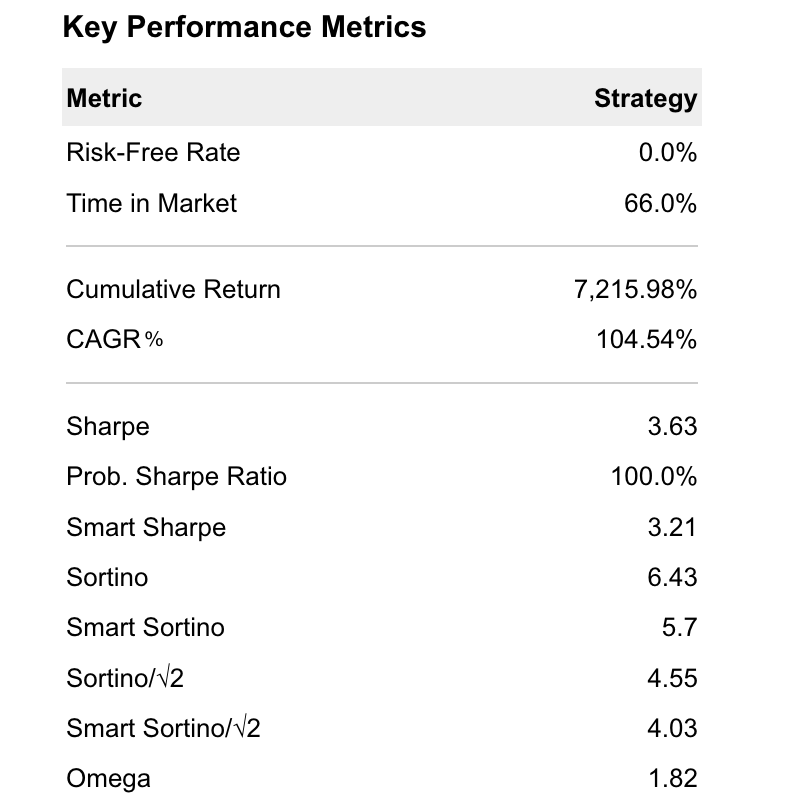
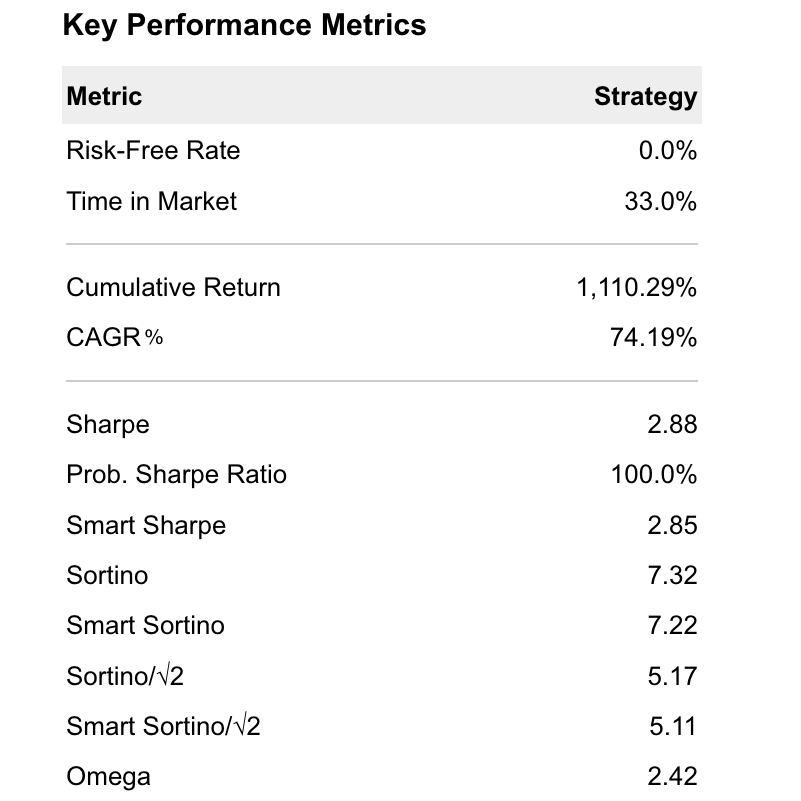
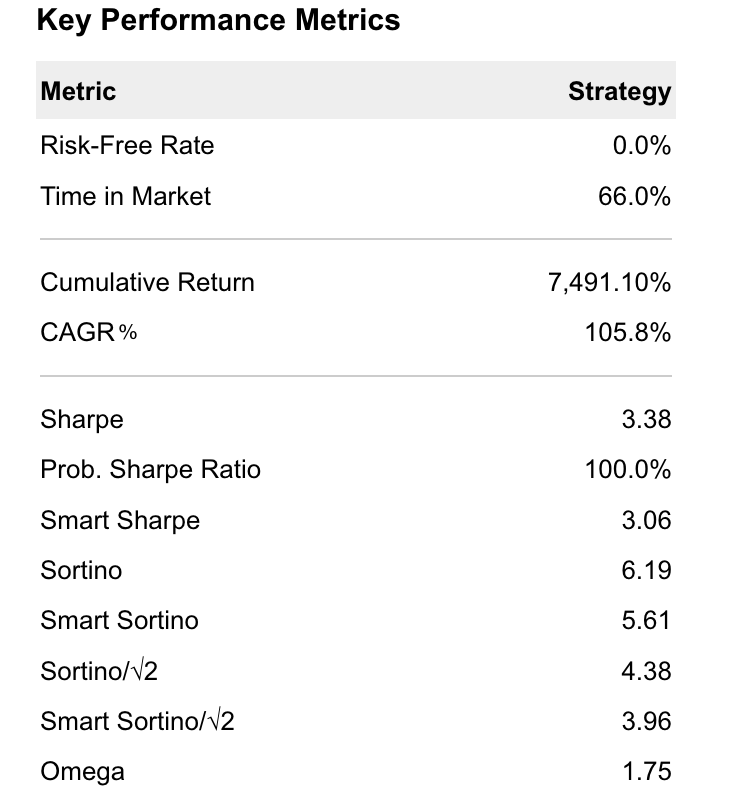
Sharpe Ratio
This metric evaluates excess return relative to risk. A high Sharpe ratio suggests effective risk-adjusted performance — ideal for long-term investors seeking stability.
Sortino Ratio
Unlike the Sharpe ratio, Sortino focuses only on downside volatility. It’s a preferred metric for conservative investors aiming to minimize losses rather than total volatility.
Calmar Ratio
Calmar considers returns relative to maximum drawdown. It’s particularly useful for long-term strategies where recovery from losses is a key performance factor.
How to Read QuantStats Reports Correctly
Understand Data in Context
Timeframe Matters
Performance metrics can vary widely depending on the time period analyzed. Always evaluate data over multiple intervals (monthly, quarterly, annually) to get a well-rounded view of the strategy.
Compare Against Benchmarks
Benchmarking helps contextualize your strategy’s performance. Comparing results against BTC, ETH, or even stable market indexes can reveal how well your approach adapts to different market conditions.
Identify Hidden Risks
Look Beyond Average Returns
Don’t be misled by high average returns. Identify what risks are being taken to achieve them. A strategy with a high return but massive drawdowns may not be sustainable.
How Drawdowns Affect Long-Term Growth
Extended or repeated drawdowns can severely affect compounded returns. Even profitable strategies may underperform if not adjusted to changing market conditions.
Data Transparency
Verify Access to Raw Data
A key aspect of reliable analysis is having access to raw data — trades, prices, execution logs. QuantStats relies on this integrity to generate accurate reports.
Use Trusted Platforms
Using secure platforms like Aquila Private ensures your strategy data is reliable and analytics are based on real, untampered performance.
Real-Life Examples Using QuantStats
Example 1: Analyzing PnL and Drawdowns
One investor noticed recurring losses during volatile market periods. By reviewing QuantStats data, they identified overexposure during drawdowns and revised their risk parameters, improving strategy stability.
Example 2: Evaluating Strategy Through Ratios
Another investor examined Sharpe and Sortino ratios in-depth. A high Sortino ratio indicated excellent downside protection, confirming the strategy’s resilience during market turbulence.
FAQ
What Data Do I Need to Analyze a Strategy with QuantStats?
You’ll need historical price data, trade logs, PnL records, drawdown figures, and volatility indicators.
How Often Should I Analyze My Strategy?
At minimum, once per quarter — more frequently if you’re operating in fast-moving or uncertain markets.
Common Mistakes to Avoid?
Overlooking drawdowns, ignoring context, and focusing only on high returns are common errors. Always evaluate risk alongside profitability.
Conclusion
QuantStats is a robust tool for evaluating algorithmic strategies in a professional and structured way. By analyzing metrics such as PnL, drawdowns, and risk ratios, investors can uncover weaknesses, monitor consistency, and improve performance.
Strategic Recommendations
Use QuantStats regularly to enhance your decision-making. Platforms like Aquila Private provide access to battle-tested strategies, combined with verified QuantStats reports — enabling you to invest with transparency, data confidence, and greater control over risk.